14 October 2016
MetaTrader 5 Build 1455: Libraries of mathematical functions in MQL5
What's new in MetaTrader 5
Terminal
-
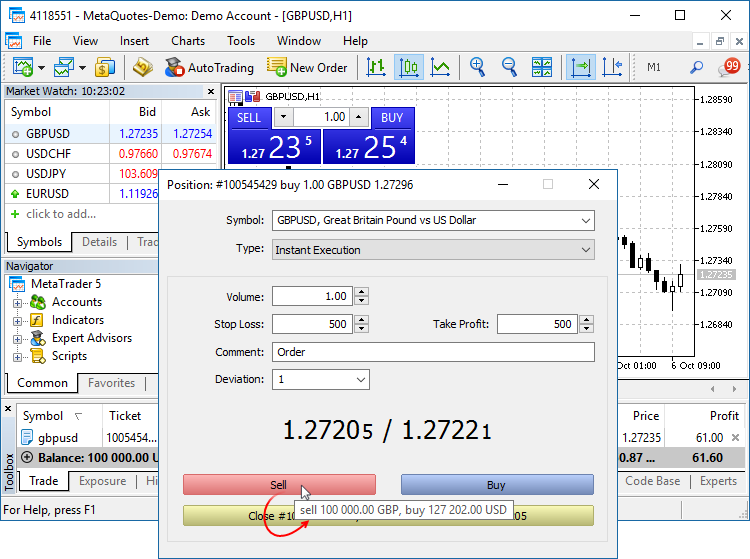
Added tooltips for the Buy, Sell and Close buttons in trade dialogs. The tooltips contain information about the security to be bought or sold during the operation, to help beginners understand the trading process.
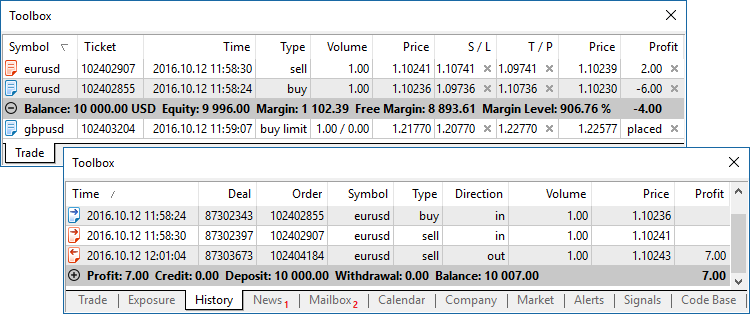
- Added new icons of orders, deals and positions in the "Trading" and "History" tabs.
- The updated terminal provides optimized and much faster (up to 4-5 times) display and update of the Market Depth, of the tick chart in the Market Depth, and of the Time & Sales data.
- Fixed synchronization of tick history during non-trading hours. The process could consume an excessive amount of network traffic in some cases.
MQL5
An MQL5 version of the ALGLIB numerical analysis library has been included into the Standard Library.
Library Features
- Linear algebra
- Systems of linear and nonlinear equations
- Interpolation
- Optimization
- Fast Fourier transformation
- Numerical integration
- Linear and nonlinear least squares fitting
- Ordinary differential equations
- Special functions
- Descriptive statistics and hypothesis testing
- Data analysis - classification, regression
- Implementing algorithms of linear algebra, interpolation, etc. in multiple-precision arithmetic (using MPFR)
How to Use
ALGLIB files are located in \MQL5\Include\Math\Alglib. To use the functions, add the main library file into your program:
#include <Math\Alglib\alglib.mqh>
-
Mathematical statistics functions have been included into the Standard Library. MQL5 now provides the functionality of the R language, which is one of the best tools for statistical data processing and analysis.
Library Features
The statistical library contains functions for calculating the statistical characteristics of data, as well as functions for operations with statistical distributions:
- Functions for the calculation of statistical characteristics of array elements
- Options for operations with statistical distributions: normal distribution, lognormal distribution, beta distribution, etc.
How to Use
The statistical library files are located in \MQL5\Include\Math\Stat. To use the library, add the file with required functions into your program, for example:
#include <Math\Stat\Binomal.mqh>
#include <Math\Stat\Cauchy.mqh>
The detailed description of the library functions is available in the article Statistical Distributions in MQL5 - Taking the Best of R.
-
The MQL5 version of the Fuzzy library has been included into the Standard Library. The Fuzzy library implements Mamdani and Sugeno fuzzy inference systems.
Library Features
- 13 membership functions
- Flexible form for developing fuzzy system rules
- Mamdani fuzzy inference system
- Sugeno fuzzy inference system
- 5 defuzzification method for Mamdani-type systems
- Unlimited amount of input and output variables
How to Use
Fuzzy Library files are located in \MQL5\Include\Math\Fuzzy. To use the library, add the file with required functions into your program, for example:
#include <Math\Fuzzy\mamdanifuzzysystem.mqh>
#include <Math\Fuzzy\sugenofuzzysystem.mqh>
A detailed description of the library is available in the Code Base: Fuzzy - library for developing fuzzy models
- New property CHART_QUICK_NAVIGATION allows
enabling/disabling quick navigation bar in the chart. If you need to
modify and access the property state, use the ChartSetInteger and
ChartGetInteger functions.
The navigation bar is opened by pressing Enter or Space. It allows you to quickly move to the specified date on the chart, as well as to switch symbols and timeframes. If your MQL5 program processes Enter or Space key pressing, disable the CHART_QUICK_NAVIGATION property, in order to avoid interception of these events by the terminal. The quick navigation bar can still be opened by a double click.
- New functions FileLoad and FileSave have been added.
They provide an easy method to read and save arrays to files. Unlike
FileRead* and FileWrite*, these functions do not require the indicator
handle. FileLoad and FileSave operate with arrays of numeric types, as
well as with simple structures that do not have strings, dynamic arrays
or class objects.
long  FileLoad(
   const string filename,      // [in] File name
   void         &buffer[],     // [out] An array to which the file is read
   uint         common_flag=0  // [in] 0 - search for the file in the Files folder of the terminal, FILE_COMMON - search in the common directory of terminals
   );

bool  FileSave(
   const string filename,      // [in] File name
   const void   &buffer[],     // [in] An array to which the file is saved
   uint         common_flag=0  // [in] 0 - create a file in the Files folder of the terminal, FILE_COMMON - create in the common directory of terminals
   );
An example of how to write ticks to a file and then read them://--- input parameters input int ticks_to_save=1000; // Number of ticks //+------------------------------------------------------------------+ //| Script program start function | //+------------------------------------------------------------------+ void OnStart() { string filename=_Symbol+"_ticks.bin"; MqlTick ticks[]; //--- int copied=CopyTicks(_Symbol,ticks,COPY_TICKS_ALL,0,ticks_to_save); if(copied!=-1) { PrintFormat(" CopyTicks(%s) copied %d ticks",_Symbol,copied); //--- If the tick history is synchronized, the error code is equal to zero if(!GetLastError()==0) PrintFormat("%s: Ticks are not synchronized. Error=",_Symbol,copied,_LastError); //--- Writing ticks to a file if(!FileSave(filename,ticks,FILE_COMMON)) PrintFormat("FileSave() failed, error=%d",GetLastError()); } else PrintFormat("Failed CopyTicks(%s), Error=",_Symbol,GetLastError()); //--- Now reading the ticks back to the file ArrayFree(ticks); long count=FileLoad(filename,ticks,FILE_COMMON); if(count!=-1) { Print("Time\tBid\tAsk\tLast\tVolume\tms\tflags"); for(int i=0;i<count;i++) { PrintFormat("%s.%03I64u:\t%G\t%G\t%G\t%I64u\t0x%04x", TimeToString(ticks[i].time,TIME_DATE|TIME_SECONDS),ticks[i].time_msc%1000, ticks[i].bid,ticks[i].ask,ticks[i].last,ticks[i].volume,ticks[i].flags); } } }
- Modified display of custom indicators with the
DRAW_CANDLES drawing mode. Now it is possible to set from one to three
colors for this mode. The display of candlesticks depends on how many
colors are set.
If one color is specified, all candlesticks on the chart will be fully painted in this color.
//--- Candlesticks painted in the same color
#property indicator_label1  "One color candles"
#property indicator_type1   DRAW_CANDLES
//--- Only one color is specified, so all candlesticks are the same color
#property indicator_color1  clrGreen
If two colors are specified, one color is used for candlestick edges, the other one is used for the body.
//--- The color of the candlesticks differs from the color of shadows
#property indicator_label1  "Two color candles"
#property indicator_type1   DRAW_CANDLES
//--- Candlestick edges and shadows are green, body is white
#property indicator_color1  clrGreen,clrWhite
If three colors are specified, one color is used for candlestick edges, two other colors are used for the bodies of bullish and bearish candlesticks.
//--- The color of the candlesticks differs from the color of shadows
#property indicator_label1  "One color candles"
#property indicator_type1   DRAW_CANDLES
//--- Candlestick edges and shadows are green, the body of a bullish candle is white, the body of a bearish candle is red
#property indicator_color1  clrGreen,clrWhite,clrRed
The DRAW_CANDLES style allows setting custom colors of candlesticks. All colors can also be changed dynamically while the indicator is running, using the function PlotIndexSetInteger(drawing_index_DRAW_CANDLES, PLOT_LINE_COLOR, modifier_number, color) where modifier_number can have the following values:
- 0 – the color of edges and shadows
- 1 – the color of the bullish candlestick body
- 2 – the color of the bearish candlestick body
//--- Setting the color of edges and shadows
PlotIndexSetInteger(0,PLOT_LINE_COLOR,0,clrBlue);
//--- Setting the color of the bullish candlestick body
PlotIndexSetInteger(0,PLOT_LINE_COLOR,1,clrGreen);
//--- Setting the color of the bearish candlestick body
PlotIndexSetInteger(0,PLOT_LINE_COLOR,2,clrRed);
- Fixed bugs and improved operation with the tick history using CopyTicks functions.
- Starting with the new build, operators can be used in interfaces (was not allowed before).
Market
-
Fixed an error that could lead to the repeated request to sign in to
MQL5.community when buying products from the Market.
Tester
- Added UI translation into Greek, Malay and Hebrew.
Updated documentation.