Exclusive Capital, an EU regulated broker, has announced the launch of a new asset class, Fractional Shares, based on the MetaTrader 5 platform.
Exclusive Capital, an EU regulated broker, has announced the launch of a new asset class, Fractional Shares, based on the MetaTrader 5 platform.
The MetaTrader 5 trading servers utilization by brokers is increased by a factor of 1.5, compared to the previous platform version ones.
Improved MQL5 program debugger.
Three new languages have been added to MQL5.com: French, Italian and Turkish.
Tickmill, the award-winning multi-asset broker, announced the addition of MetaTrader 5 to its range of trading platforms.
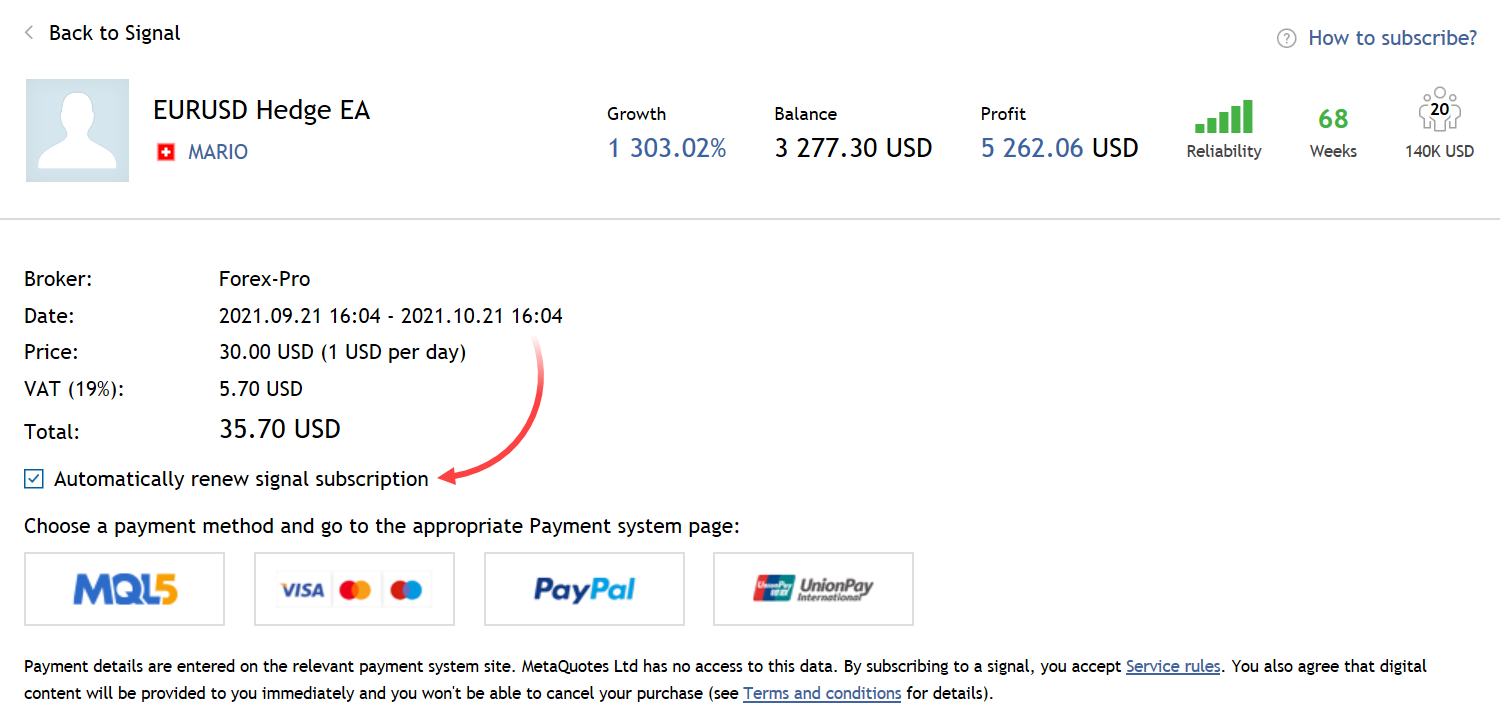
Market, Signals and VPS sections have been moved from the main platform workspace to the Navigator. The new positioning provides easy access to the desired products and enables efficient management of purchases and subscriptions. "How it works" sections have been added to each service, to provide the basic usage information.
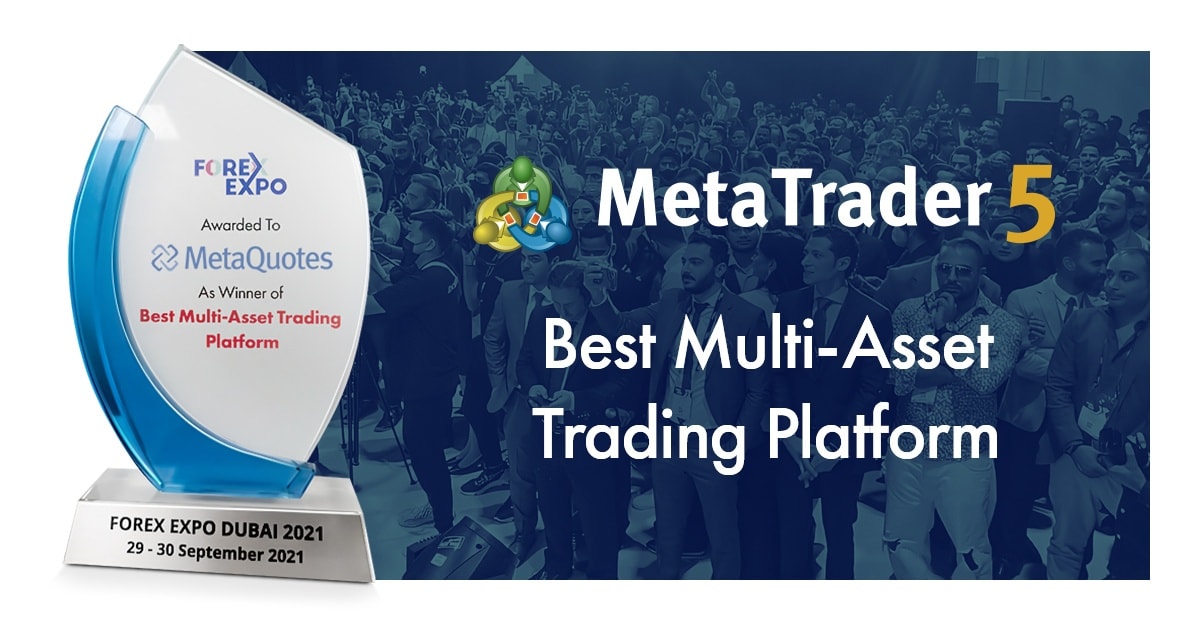
Our trading platform has been recognized as the winner of the "Best Multi-Asset Trading Platform" award at the Forex Expo Dubai 2021, which was held on September 29 and 30.
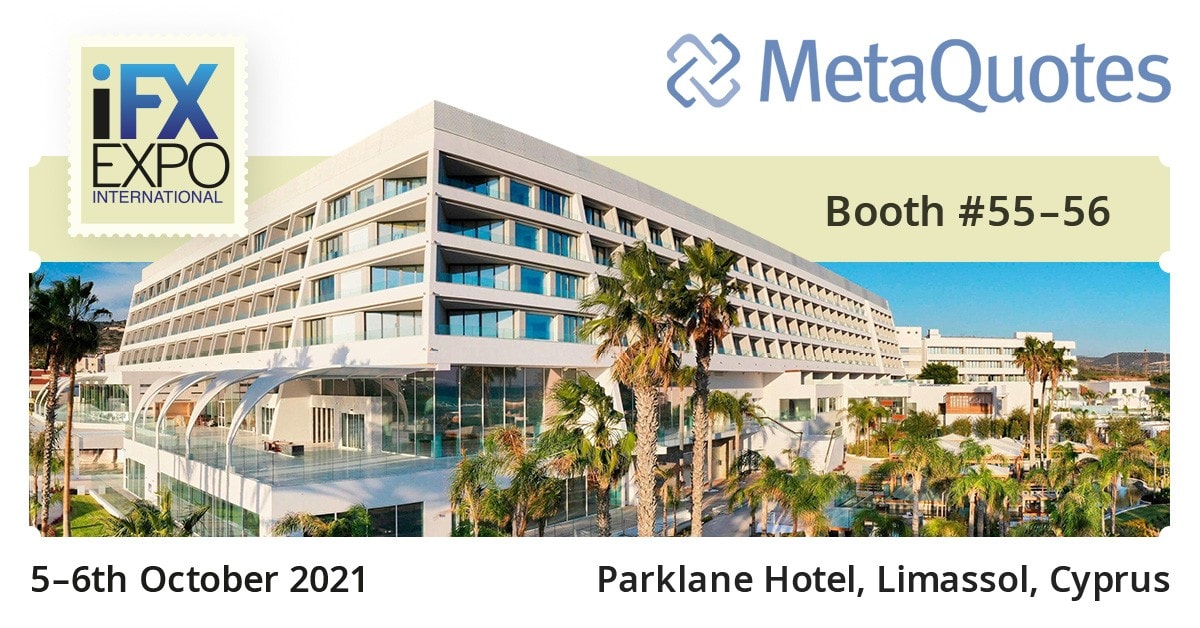
On October 5 and 6, our company will participate in iFX EXPO International 2021. This year's flagship conference for fintech, e-commerce and financial services executives will be held in Limassol. The event is expected to be attended by at least 35000 visitors, including broker representatives, liquidity and high-tech solutions providers, bankers, regulatory organizations representatives and other
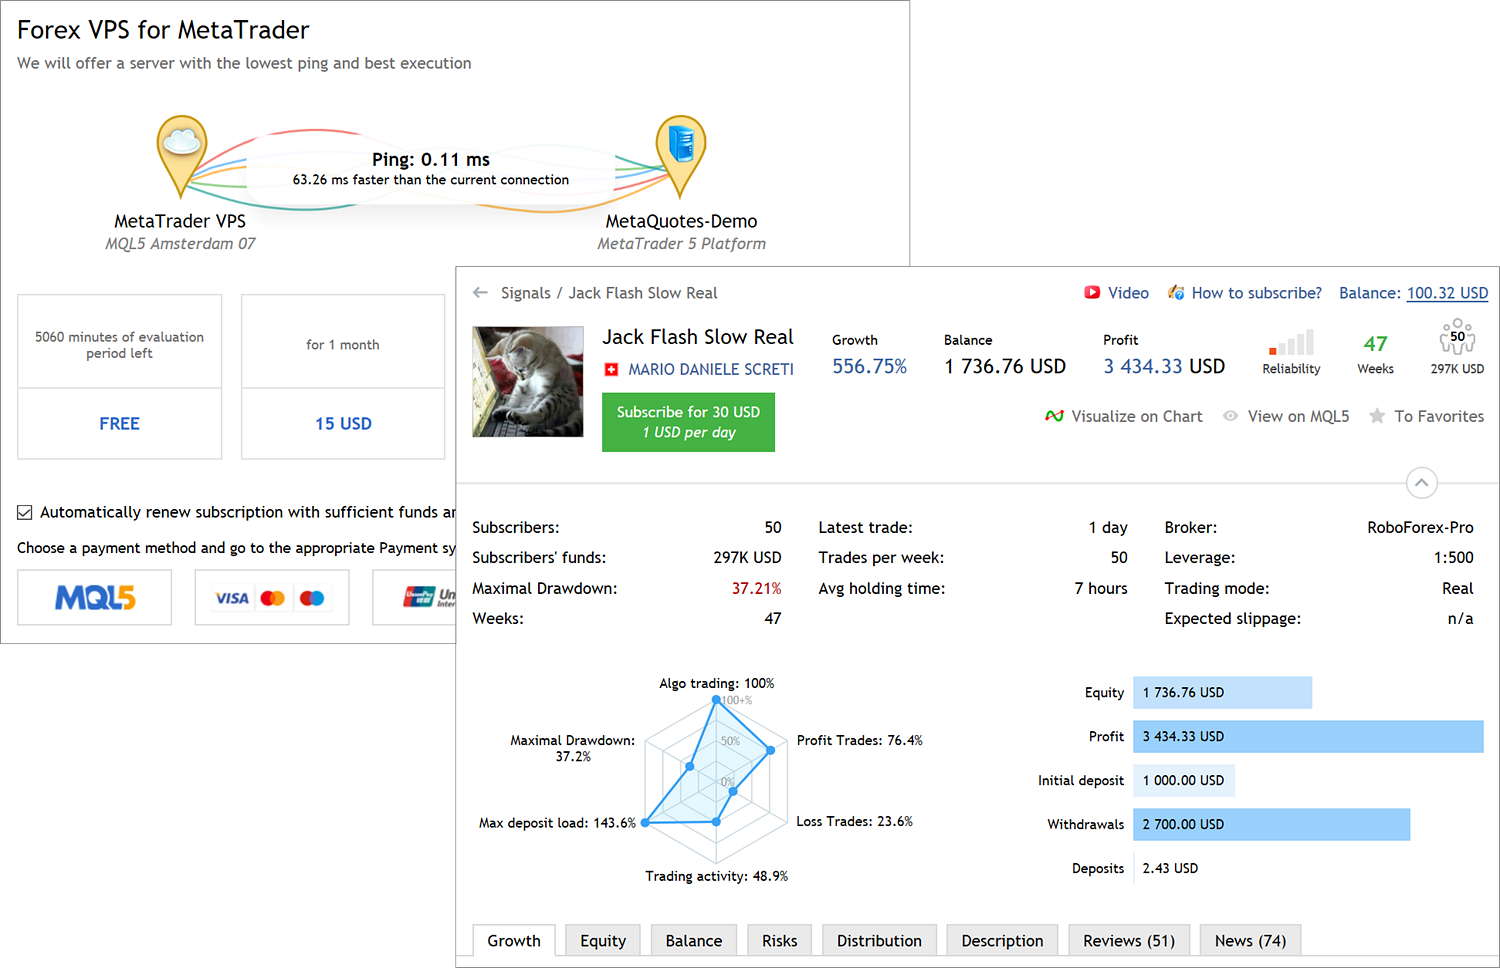
Companies create new offerings for traders utilizing robots and trading signals. One of the most efficient strategies, concerns the availability of a free of charge VPS for round-the-clock trading — in this case, brokers provide servers for algorithmic trading at their own expense.

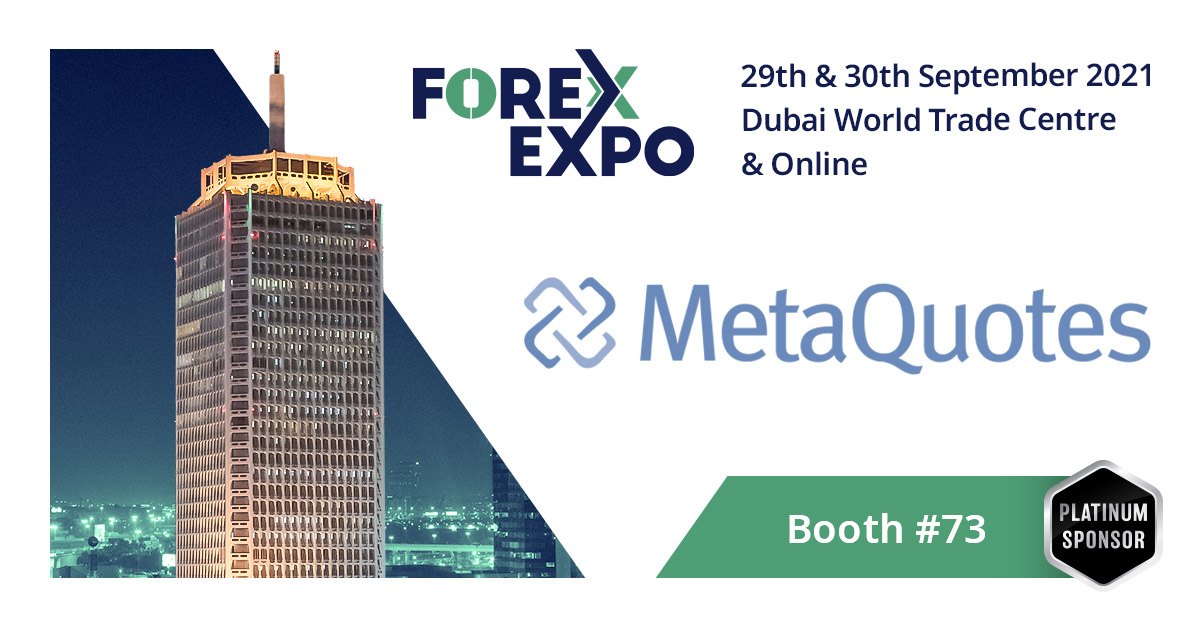
MetaQuotes becomes a platinum sponsor of the Forex Expo Dubai 2021, the largest Middle East B2B/B2C exhibition, which will be held at the World Trade Centre between September 29-30.
Just2Trade, a licensed European broker, has expanded its trading capabilities available via MT5 Global accounts. Using MetaTrader 5, the broker's customers can trade options on leading US exchanges, such as CBOE and NASDAQ.
Axiory Global, a regulated broker operating in the market for a decade, has announced an expansion in its product offering — the company has launched a direct investments account in the MetaTrader 5 platform. Through the brand new MT5 Alpha Account, traders and investors can buy stocks and Exchange Traded Funds (ETFs).
MetaQuotes Ltd has joined the professional fund services directory of HFM Connect alongside the most advanced products of IT services dedicated to infrastructure solutions, risk management and cloud technology for global hedge funds.
The regulated Australian broker GO Markets has included Hong Kong market assets into its offering, in addition to the previously available ASX and US shares.
Libertex, a regulated Cyprus-based broker, has launched MetaTrader 5 with demo and real accounts
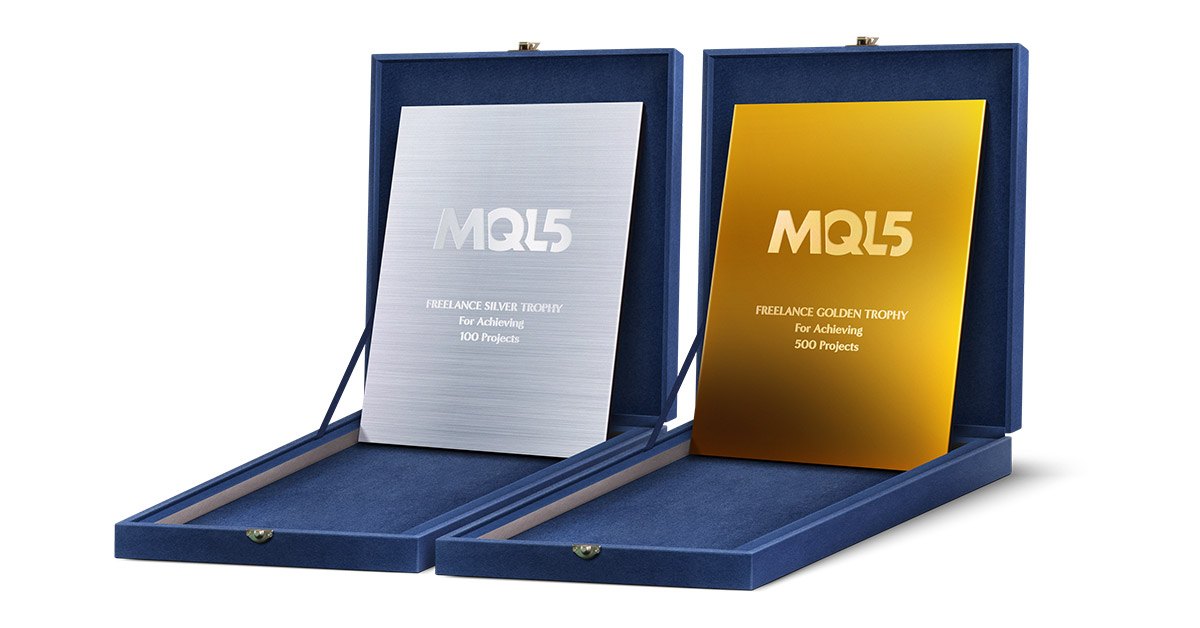
Everyone who achieves (or has already achieved) a certain number of Market sales or completed Freelance orders will receive a nameplate.
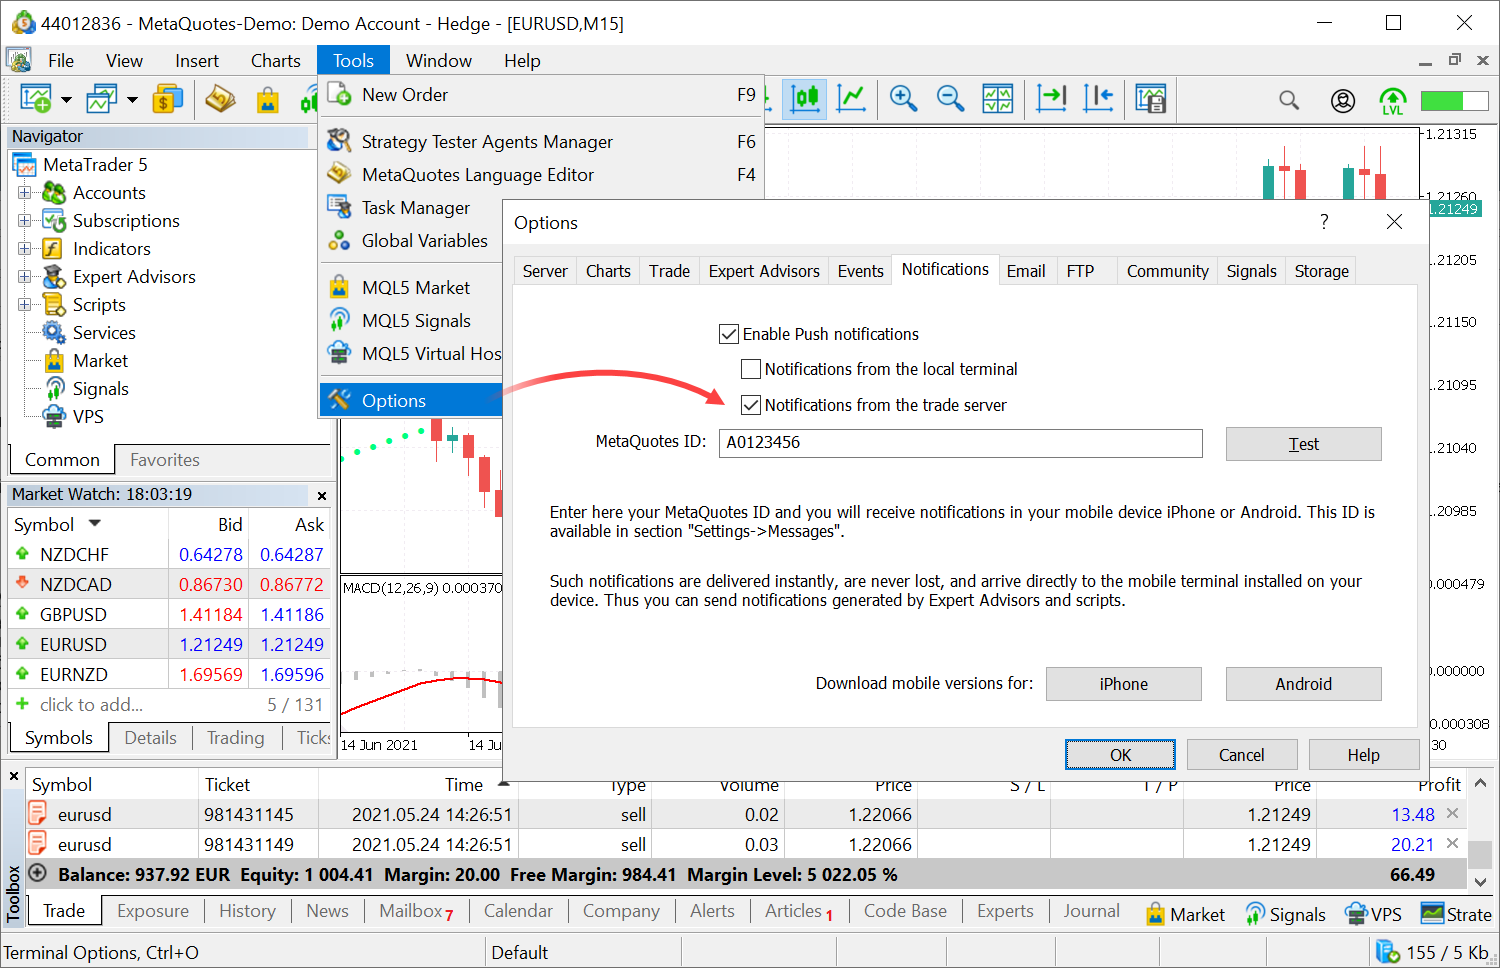
If a Take Profit triggers on the server while your computer is turned off, you will receive a notification about a closed position from the server.
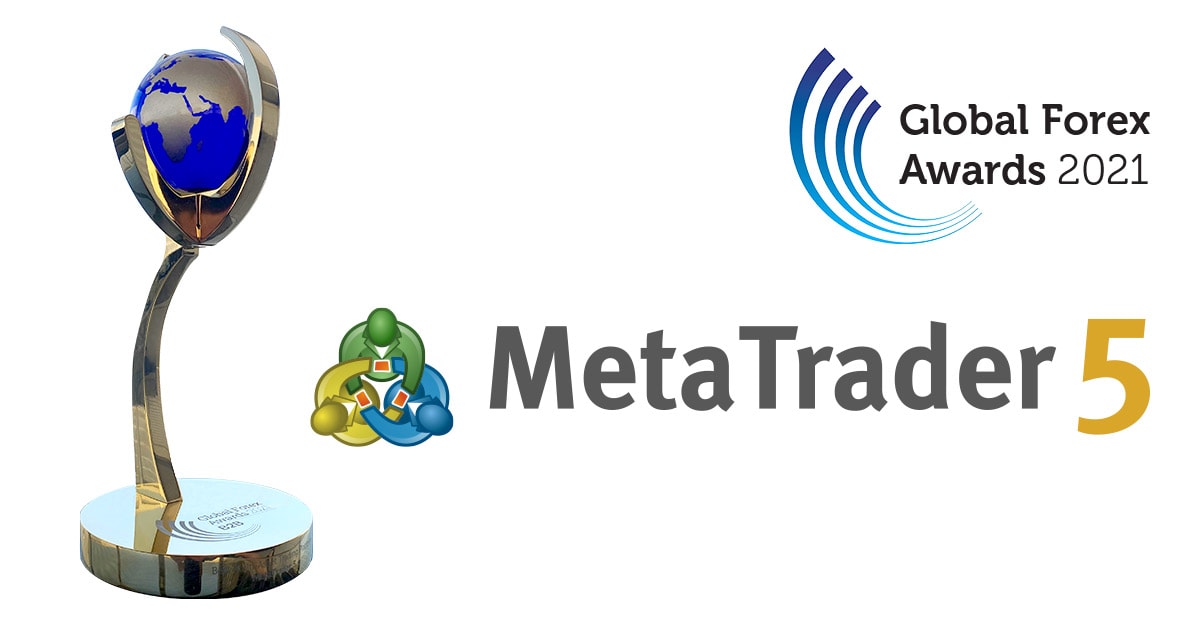
The MetaTrader 5 trading platform has won the Best Multi-Asset Trading Platform award at the Global Forex Awards 2021. This award recognizes the best solutions which enable an innovative and value-driven approach to multi-asset trading and technological integration.
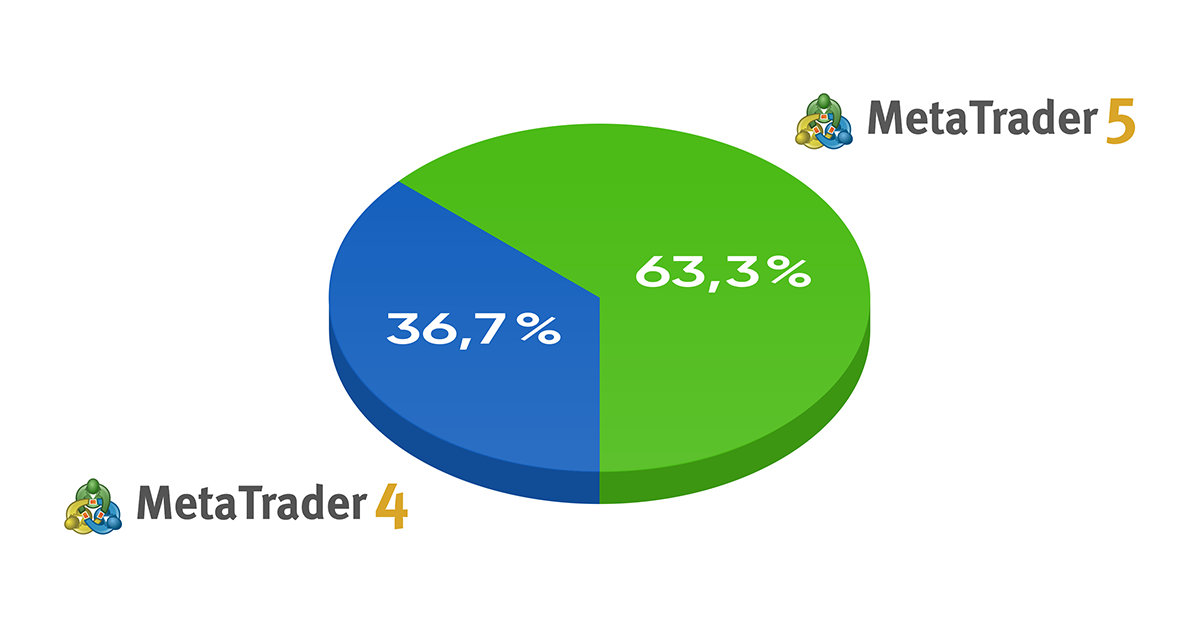
MetaTrader 5 has become the most popular trading platform. The number of companies using MetaTrader 5 has exceeded the ones using MetaTrader 4 in June 2021.
Trading services, including Market, Signals and Virtual Hosting are now conveniently displayed in the platform's main working area.